There is no single correct indoor humidity, which is why the charts you find elsewhere disagree with each other. The right number depends on the season, on how cold it is outside, on which room you are standing in and on the climate you live in.
This page collects all four in one place. If you want the short version: 30–50% is the healthy band, 40–50% is the comfortable middle of it, and the winter target falls as the outdoor temperature does.
The overall range
The 30–50% band comes from the point where several risks are simultaneously near their minimum: dust mites need around 50% to thrive, mold germinates near 80% at a surface, and dry airways below 30% clear viruses less effectively.
| Reading | What it means | What to do |
|---|---|---|
| Below 25% | Static shocks, nosebleeds, cracked wood and furniture joints | Humidify — see the winter table below |
| 25–30% | Typical heated house in winter; dry skin and airways | Humidify toward 40% |
| 30–40% | Low end of healthy. Fine, and correct in a hard freeze | Acceptable |
| 40–50% | The comfortable middle | Target |
| 50–60% | Dust mites thrive; cold surfaces begin to sweat | Ventilate, watch the coldest room |
| 60–70% | Mold takes hold on cold walls and behind furniture | Dehumidify |
| Above 70% | Active mold and dust-mite risk; damage to plaster and framing | Find the source now |
Winter: the target falls with the outdoor temperature
This is the table most charts leave out, and the one that prevents the most damage. Your coldest surface follows the outdoor temperature, so the humidity you can safely hold falls as it gets colder outside.
Figures below are conservative for a typical double-pane house. Single-pane glass or metal frames need lower; well-insulated triple-pane glass tolerates more.
| Outdoor temperature | Indoor target | If you go higher |
|---|---|---|
| Above 40 °F | 45% | Comfortable, little risk |
| 20 to 40 °F | 40% | Light morning condensation on the coldest windows |
| 10 to 20 °F | 35% | Water on the glass, wet sills |
| 0 to 10 °F | 30% | Streaming windows, frames staying wet |
| −10 to 0 °F | 25% | Ice forming on the inside of the glass |
| Below −10 °F | 20% | Ice, and frost risk in the attic from leaking air |
By room
Colder spaces need lower targets, because their surfaces reach the dew point sooner. A bathroom is the exception — it is supposed to spike, and what matters is recovery time.
| Room | Target | Why |
|---|---|---|
| Bedroom | 40–50% | Two sleeping adults add about a pint overnight |
| Bathroom | Under 60% in 20 min | Peaks past 90%; recovery is the measure |
| Kitchen | Under 60% | Second-largest moisture source in the house |
| Laundry room | Under 60% | Largest single source if the dryer vents indoors |
| Basement | 50% or below | Coldest surfaces in the building, year-round |
| Crawl space | 55% or below | Only achievable once the ground is sealed |
| Garage | 50–60% | Rust, not mold, sets the limit |
| Closet | 45–55% | Still air against the coldest wall in the room |
| Nursery | 40–50% | Small airways; steadiness matters more than the exact figure |
| Attic | Tracks outdoors | A vented attic should be close to outdoor conditions |
By climate
A national average target is a compromise between climates that need opposite things. Chasing 40% in Florida costs a fortune; holding 50% in Minneapolis in January puts water on your windows.
| Climate | Target | Where |
|---|---|---|
| Hot and humid | 45–55% | Florida, Gulf Coast, Southeast |
| Hot and dry | 30–40% | Arizona, Nevada, New Mexico |
| Cold winters | 30–40%, sliding | Upper Midwest, Northeast, Mountain |
| Mild and damp | 40–50% | Pacific Northwest |
| Four seasons | 30–50%, seasonal | Mid-Atlantic, Ohio and Tennessee valleys |
For things rather than people
Materials care about stability more than the exact figure. Repeated large swings do more damage than a steady reading slightly outside the ideal.
| What | Range | Failure mode outside it |
|---|---|---|
| Hardwood floors | 35–55% | Gaps when dry, cupping when wet |
| Musical instruments | 40–50% | Cracked soundboards, shifting action |
| Books and paper | 35–50% | Brittle when dry, foxing and mold when damp |
| Artwork and photographs | 40–50% | Cockling, emulsion damage |
| Wine storage | 50–70% | Corks dry out below 50% |
| Tools and firearms | Below 50% | Rust accelerates above about 60% |
| Electronics in storage | Below 60% | Corrosion on contacts and boards |
Reading the chart against your own building
A target table is only as good as the assumptions behind it. These are the four that decide whether the number in the chart applies to your house.
The first is glazing, and it is by far the largest variable in winter. The inner surface of a window is the coldest thing in most rooms, and how cold depends almost entirely on how many panes are between you and the weather. At an outdoor temperature of 0 °F, single-pane glass forces the indoor ceiling down to roughly 10%, standard double-pane glass allows about 30%, low-e double-pane glass about 40%, and triple-pane glass about 45%. Those are not small differences — they are the difference between a comfortable house and a wet one.
The second is wall construction. A solid masonry wall with no insulation runs several degrees below room temperature all winter, and an exterior corner runs colder still because it loses heat in two directions. An insulated cavity or a wall with internal insulation stays close to room temperature, which raises the surface humidity threshold considerably. If your chart target seems impossible to hold without growing mold in a corner, the wall rather than the number is usually the problem.
The third is occupancy. The chart assumes a normally occupied house. A sleeping adult adds up to a pint of water overnight; a family of four adds two to three pints before anybody showers or cooks. A house with more people in it than the design assumed will sit above the target no matter how disciplined the habits are, and needs mechanical help rather than more effort.
The fourth is what the room is for. A bathroom is supposed to spike past 90% and the useful measure is how fast it recovers, not the peak. A basement needs a lower target than a bedroom because its surfaces are colder. A room storing books, instruments or wine wants stability more than any particular value — 45 to 55% held steady beats 40% that swings twenty points with the seasons.
Finally, treat the winter figures as ceilings rather than goals. The chart tells you the highest humidity your building will tolerate at a given outdoor temperature. If a lower figure is comfortable for the people in the house, there is no benefit in pushing toward the limit, and a couple of points of margin costs nothing.
Download the chart
PNG for the web, PDF for a page you can print and pin up by the thermostat.
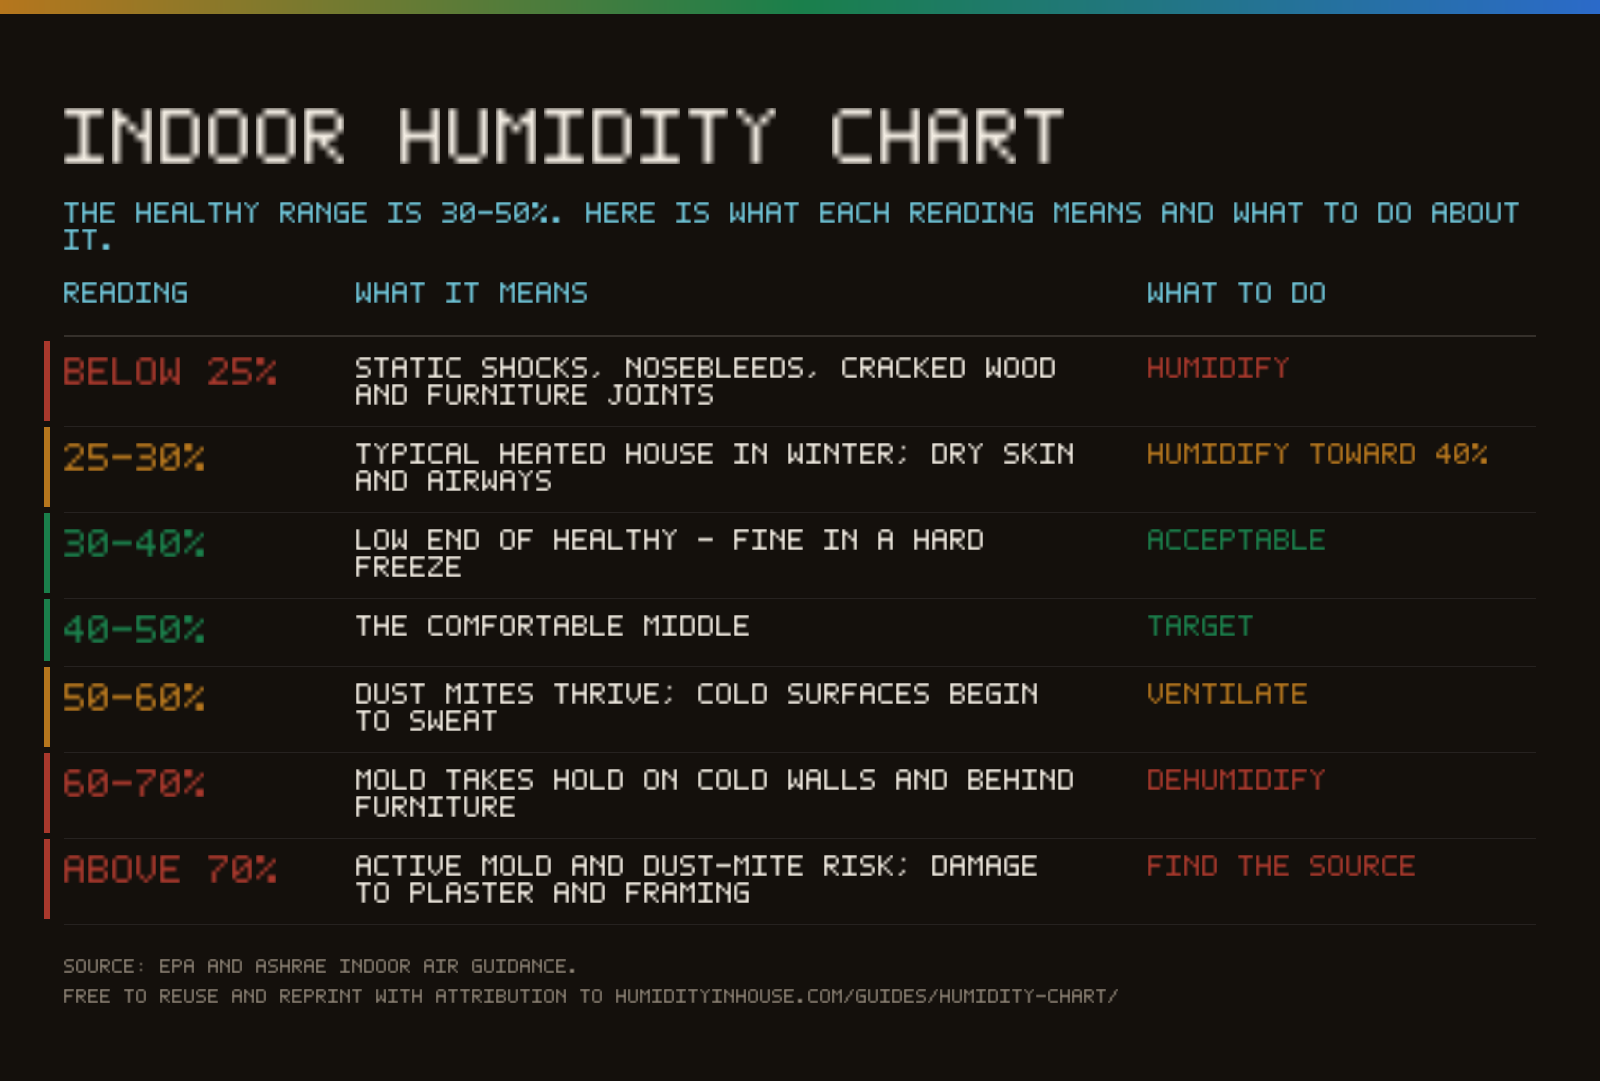
Free to reuse and reprint under a CC BY 4.0 license — keep the attribution link to humidityinhouse.com/guides/humidity-chart/ and it is yours, on your own site or in print.
<a href="https://humidityinhouse.com/guides/humidity-chart/"><img src="https://humidityinhouse.com/assets/downloads/humidity-chart.png" alt="Indoor humidity chart: what each reading means and what to do about it" width="800"></a>Common questions
What is the ideal indoor humidity chart?
There are four that matter, and they are all on this page: the overall 30–50% band, the winter table where the target falls with the outdoor temperature, the room-by-room targets, and the climate targets.
Should indoor humidity be different in summer and winter?
Yes. 45–50% is comfortable in summer; in winter the ceiling is set by how cold your windows get, which means 40% in mild weather down to 25% in a hard freeze.
What humidity is best for hardwood floors and instruments?
35–55% for floors and 40–50% for instruments, with stability mattering more than the exact number. Repeated swings cause more damage than a steady reading slightly outside the range.
Is 60% humidity too high indoors?
It is the upper limit rather than a disaster. Dust mites thrive there and cold surfaces start to condense, so treat 60% as the point to act rather than the point where damage begins.
Should I print this chart and follow it exactly?
Use it as a starting point and then let your own windows correct it. The chart cannot know that one window has a failed seal, that a bedroom sits over an unheated garage, or that a corner has a thermal bridge. Set the humidity from the chart, look at the coldest glass in the house on a cold morning, and adjust from what you see. The building is the final authority.
Why do different sources give different ideal humidity ranges?
Because they are optimizing for different things. Health guidance converges on 30 to 50% because that band minimizes mold, dust mites, bacteria and respiratory irritation together. Comfort standards allow a wider range because people tolerate more than pathogens do. Conservation guidance for books and instruments recommends a narrower, higher band because material stability matters more than anything else. None of them is wrong; they are answering different questions.
Sources
- US EPA — Mold and moisture guidance — the 30–50% range and the 10 sq ft remediation threshold
- ASHRAE Standard 55 — Thermal environmental conditions for human occupancy — indoor comfort and humidity limits
- US DOE 10 CFR 430 — Dehumidifier test procedure — the 2019 move to 65 °F rating conditions